Search Knowledge Base by Keyword
30 Lines Insights Login & Navigation Guide
30 Lines Insights Login & Navigation Guide
Welcome Email
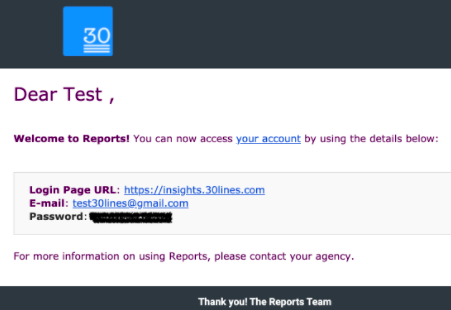
You will receive a welcome email inviting you to the platform. The email will outline the login URL (insights.30lines.com), confirm the email address that will be used to log in, as well as the password set for you by the 30 Lines team. This login link will expire in 72 hours, so log in as soon as possible.
Logging In
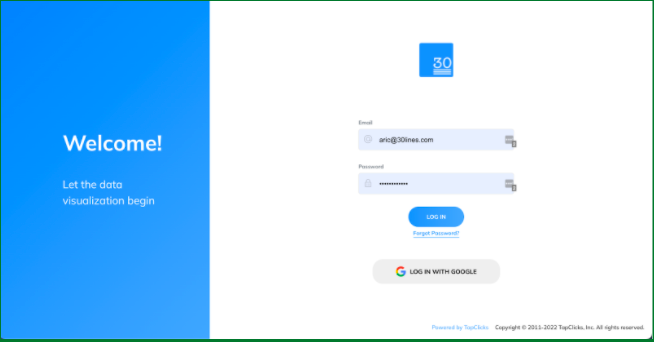
Use the link provided, or type in the URL, to visit the login page. Use the credentials provided to log in to the platform. We recommend bookmarking the login page so you can easily access your reports whenever you need them.
Navigating the 30 Lines Insights Platform
Navigation Bar
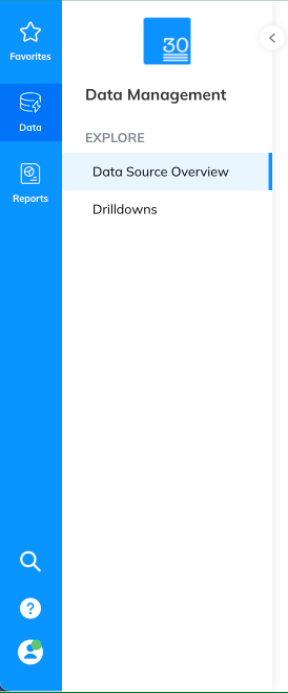
The navigation bar is the blue bar found on the left side of the interface. It has 3 main categories; Favorites, Data and Reports. When any of these is selected, the sub navigation bar will change to display relevant subcategories. In the example provided, Data has been selected, and the sub navigation is displaying data related subcategories. Let’s break down each category in order of importance.
Reports
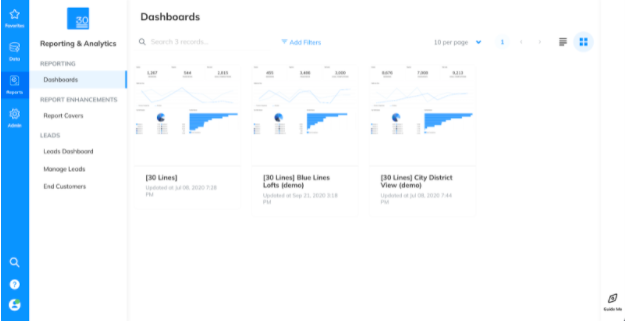
Reports is where you’ll find the most important part of the platform; your insights dashboards. To find them, simply click on “Dashboards” in the sub navigation. Here you will see each of your insights dashboards displayed in a grid.
Your insights dashboards are easy to read reports for your properties. These are labeled following a simple structure. As a default you will have are report labeled only in brackets. In the example, this is the [30 Lines] dashboard. For you, this will display your management company’s name. This report is a rollup report, and the data it displays is the sum of all properties you have signed on with 30 Lines services. You can use this to get a general idea of how your portfolio is performing as a whole.
The other dashboards can be found using the property name after the bracketed label. These dashboards display information regarding a single property. In the example above they are labeled as, [30 Lines] Blue Line Lofts, and [30 Lines] City District View. If you’re interested in how a single property is performing, these will be your best tool.
If you have a large number of properties running 30 Lines services, consider using the search bar found towards the top of the page to find the dashboard for a specific property.
Data
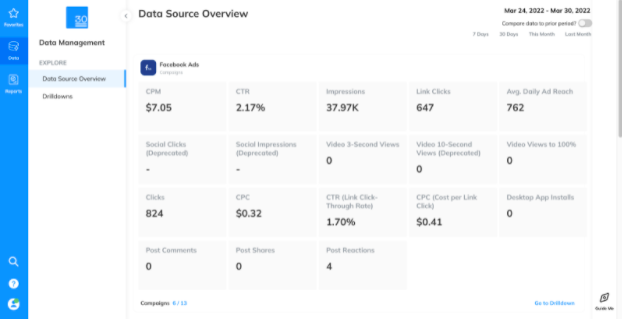
In Data you’ll find the ability to breakdown each data source in depth. These typically include Google Analytics, Google Ads, and/or Facebook Ads.
In Data Source Overview, you’ll be able to view a sum of all of your properties for a given data source together to get a feel for general performance. For a more detailed breakdown of individual campaign performance, select Drilldowns in the sub navigation bar, or click “Go to Drilldowns” under a given data source. Each data source drilldown will provide relevant metrics for individual campaigns.